Jupyter Visualization
Since version 0.4.0, we added experimental support for Jupyter
visualization with WebGL. If Open3D is installed from pip or conda
repository, Jupyter supported is enabled by default. If Open3D is compiled from
source, please refer to 2. Setup Python binding environments on how to build
Open3D with Jupyter visualization support.
Note that Jupyter Visualization is still at an early experimental stage. Here are the main limitations:
Only point cloud geometry is supported.
Camera is initialized with fixed parameters, therefore, the initial view may not be optimal for the point cloud.
Performance is not optimized.
Controls
Mouse wheel: zoom in/out
Left mouse button drag: rotate axis
Right mouse button drag: panning
Example usage
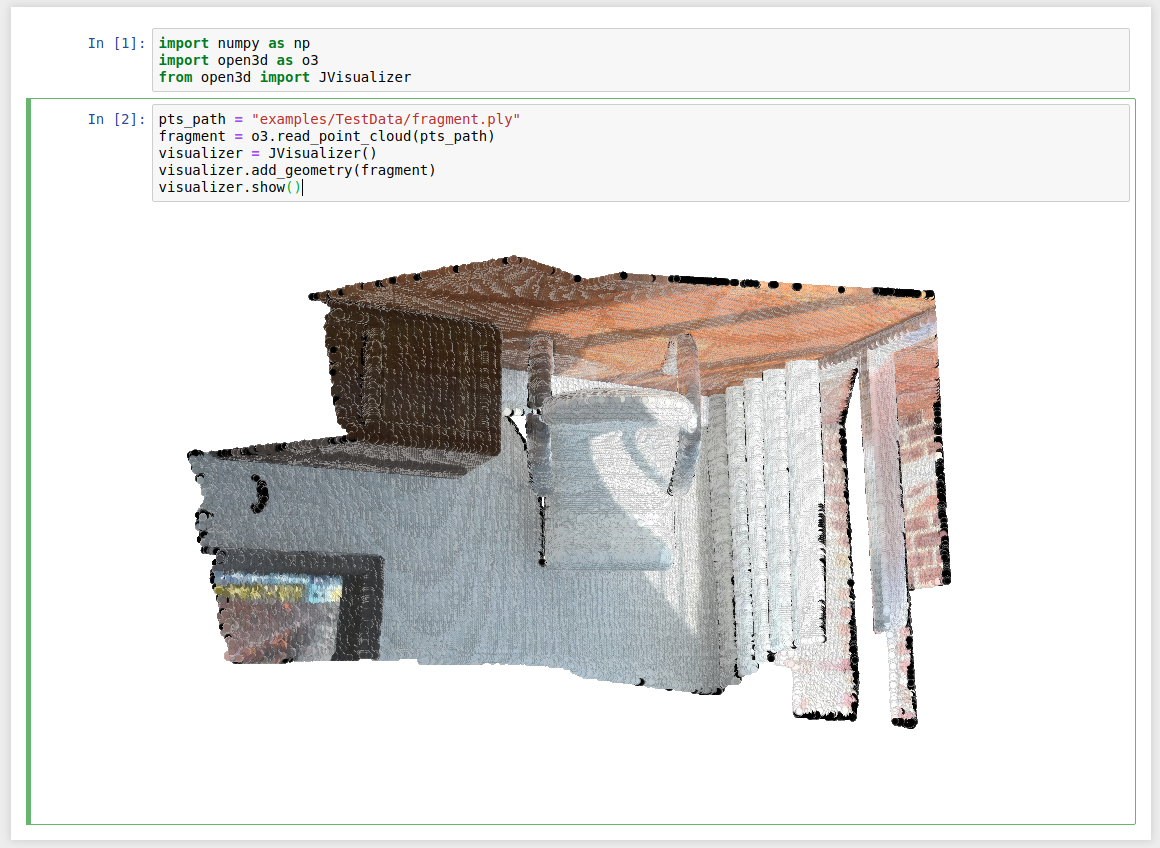
Jupyter visualizer is defined in the JVisualizer class.
Initialize the class, call add_geometry to add an Open3D
geometry, and then call the show to display the Jupyter widgets.
import numpy as np
import open3d as o3
from open3d import JVisualizer

pts_path = "examples/TestData/fragment.ply"
fragment = o3.read_point_cloud(pts_path)
visualizer = JVisualizer()
visualizer.add_geometry(fragment)
visualizer.show()
If the point cloud is not visible (due to the fixed camera initialization), try first zooming in/out with mouse wheel, and dragging right button of the mouse to pan.
Here’s a link to the example outputs.